Waddah Attar Explosion
Waddah Attar Explosion is a free momentum indicator that combines MACD and Bollinger Bands into a color-coded histogram, flagging bullish and bearish momentum breakouts across MT4 and MT5.
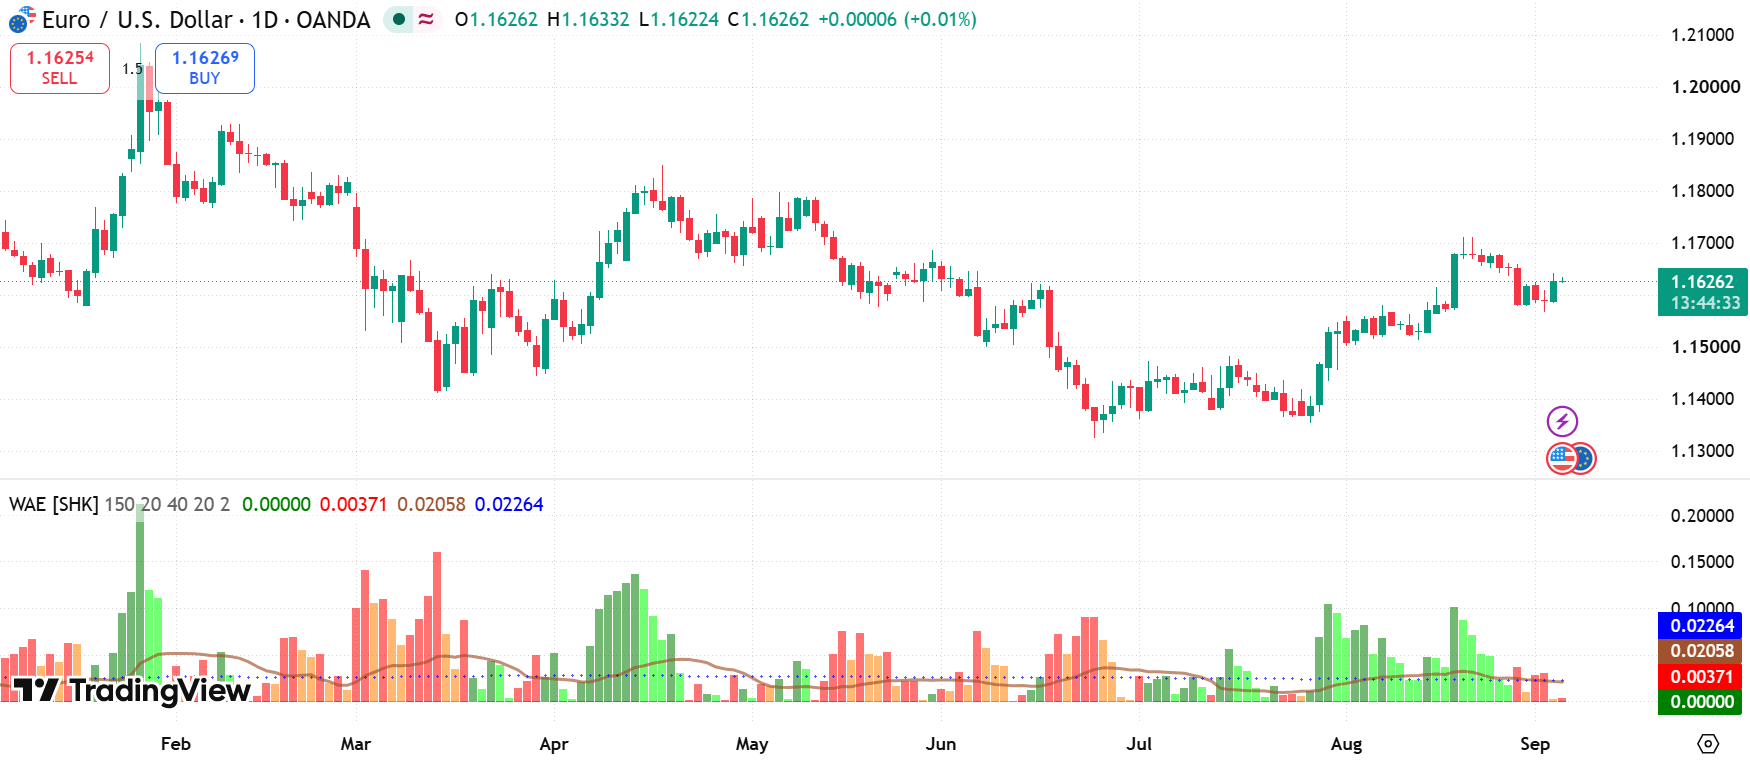
Waddah Attar Explosion is a free momentum indicator that combines MACD and Bollinger Bands into a color-coded histogram, flagging bullish and bearish momentum breakouts across MT4 and MT5.
- •FBFX Score of 90/100 (low risk profile)
- •Non-repainting, signals hold once plotted
- •Runs on MT4, MT5
- •Best suited to H1
Waddah Attar Explosion is a free MT4 and MT5 histogram indicator that combines a MACD-style momentum reading with a Bollinger Band measure of volatility expansion. It is widely described as a breakout signal, which overstates it: the histogram measures how forcefully price is moving and how far the bands are widening, not whether a breakout will hold.
Two series do the work. The explosion histogram plots momentum magnitude coloured by direction, and a second line plots the volatility expansion the bands imply. The interpretation the construction actually supports is that momentum matters only when it outpaces the volatility line, not whenever it simply rises.
| Platforms | MT4, MT5 |
| Repaints | No |
| Signal type | Leading |
| Best timeframe | H1 |
| Best pairs | Any liquid forex pair; commonly run on majors like EUR/USD and GBP/USD |
| Category | Score | What we checked |
|---|---|---|
| Repaint behavior | 30/30 | Marketed and checked as non-repainting |
| Signal reliability | 25/25 | Leading, best on H1 |
| Transparency | 20/20 | 3 FAQs answered on this page |
| Value for money | 10/15 | 4 documented strengths vs. 3 documented drawbacks |
| Usability | 5/10 | Available on MT4, MT5 |
- ✓Free to download, with the original version published in the public MQL5 Code Base since 2007
- ✓Calculation is public, so repaint behaviour can be settled by inspecting the formula rather than trusting a vendor claim
- ✓Combines two well-understood tools, MACD and Bollinger Bands, into one visual momentum-and-volatility read
- ✓Fully adjustable sensitivity, dead zone, and trend power inputs for tuning signal frequency
- ✕Being MACD-derived, it inherits the lag of any moving-average-based calculation and will not call a move before it starts
- ✕The dead zone is an absolute pip threshold, so a setting tuned on one instrument behaves completely differently on another
- ✕Widely copied and re-hosted across download sites, so the build you download may differ from the original published code
- ✓Combines MACD momentum and Bollinger Bands volatility into one visual histogram
- ✓Free and publicly available since its original 2007 MQL5 Code Base release
- ✓Adjustable sensitivity and dead zone settings to control signal frequency
- ✓Color-coded bars make bullish/bearish momentum shifts readable at a glance
The formula, in full
MACD      = EMA(Close, Fast) - EMA(Close, Slow)
Trend     = (MACD[t] - MACD[t-1]) * Sensitivity
Explosion = Abs(Trend)
Direction = Sign(Trend)
Signal    = BandUpper(N, Dev) - BandLower(N, Dev)
DeadZone  = Fixed pip threshold

Significant bar when:
  Explosion > Signal  AND  Explosion > DeadZone
- Every input is causal: an EMA depends on the current close and the previous EMA, and a Bollinger Band on a trailing window. No value requires data from a later bar, which is why the closed-bar history cannot repaint.
- Because the histogram is built from the change in MACD rather than MACD itself, it responds to acceleration, not level. Momentum can be strongly positive while the bar shrinks.
- The signal line is Bollinger Band width, so it rises in any volatility expansion regardless of direction. A bar clearing it means momentum outpaced current volatility, not that direction is confirmed.
- The dead zone is an absolute pip threshold, so the same value behaves very differently across instruments with different typical ranges. It does not scale automatically.
- Sensitivity multiplies the whole histogram. Raising it makes more bars clear both thresholds without anything changing in the underlying market.
When it misleads you
| Regime | Detect with | Signal quality | What to do |
|---|---|---|---|
| Volatility expansion with direction | Bands widening while the histogram clears the signal line | Best case. Momentum is genuinely outpacing current volatility. | Use it to confirm an entry you already had an independent reason for. |
| Expansion without persistence | Bands widening but the histogram flipping colour bar to bar | Misleading. Expansion with no follow-through looks identical to a real signal. | Require two or three consecutive same-colour bars before acting. |
| Low volatility drift | Bars sitting below the dead zone | Suppressed by design. This is the filter doing its job. | Nothing to do. Do not lower the dead zone to manufacture signals. |
| Post-gap open | Weekend or news gap on the first bars of the session | Distorted. The EMA change is dominated by the gap itself, not by trading. | Discard the first bars after a gap rather than reading them. |
Three ways to actually use it
Because Waddah Attar Explosion exposes sensitivity, dead zone, and trend power as adjustable inputs, its out-of-the-box behavior on a fresh chart is really just one of many possible configurations, not a fixed, tested signal. Two traders running the same indicator with different sensitivity settings will see meaningfully different signal frequency and quality on the exact same chart. That flexibility is a strength for traders willing to spend time tuning it against their own pair and timeframe, but it also means broad claims about the indicator's accuracy are close to meaningless without specifying which settings were used. Anyone evaluating it seriously should treat the default configuration as a first draft, not a verdict on the tool itself.
Where it came from
The original Waddah Attar Explosion was published to the public MQL5 Code Base in 2007 by its namesake author, and has stayed in circulation ever since, re-hosted and re-packaged for both MT4 and MT5. That longevity in a space where most free indicators disappear within a year or two counts for something, and more usefully, it means the calculation is public and can be examined rather than taken on trust.
How it combines two familiar tools
Rather than inventing a calculation from scratch, the indicator derives its histogram from the MACD oscillator and layers a Bollinger Band measure of volatility on top as a signal line. The result plots as colour-coded bars, one colour for building bullish momentum and another for bearish, with bars rising above the signal line marking the point where momentum has outpaced current volatility. Because it is assembled from two tools most traders already understand separately, the learning curve is shorter than for a proprietary black box.
How to use Waddah Attar Explosion
This indicator is misused more often than it is misconfigured, and both problems have the same fix: decide in advance that it is a confirmation layer, not a trigger.
- Set the dead zone for the specific symbol before anything else. It is an absolute pip value, so a setting that filters sensibly on EUR/USD will silence Gold completely or let through every bar on a low-range cross. Tune it so it suppresses roughly the quietest third of bars on your timeframe, and re-derive it per instrument.
- Read three conditions together, never one. The bar must be the colour of your intended direction, it must be above the signal line, and it must be above the dead zone. Two out of three is not a signal.
- Find your setup with something else first. Use structure, a trend read, or a level. Only then look at the histogram to decide whether the move has force behind it.
- Require two or three consecutive same-colour bars before acting. A single bar clearing the threshold is frequently a volatility spike that reverses.
- Only read closed bars. More on why below, but this single rule removes most of what people complain about with this indicator.
- Leave sensitivity alone until you understand the dead zone. Raising sensitivity multiplies every bar, which makes more of them clear both thresholds without anything having changed in the market.
Does Waddah Attar Explosion repaint?
Because the calculation is public, this can be settled with arithmetic instead of opinion, which is unusual for this question.
Every input is causal. An exponential moving average at a given bar is a function of that bar's close and the previous bar's EMA, and nothing else. A Bollinger Band at a given bar is the mean and standard deviation of a trailing window ending at that bar. The histogram is the change in MACD from the previous bar to the current one, multiplied by a constant. At no point does a value at one bar require data from the bar after it.
An indicator built only from causal inputs cannot repaint on closed bars. There is no mechanism by which a later candle could reach back and alter an earlier histogram value, because no later candle is an input to it. Reload the terminal and the same price history produces the same bars.
The forming bar is a different matter, and it is where nearly every repaint complaint about this indicator originates. Until the current candle closes, its close price is simply the last tick, so the current histogram bar moves, changes height, and can flip colour several times before the period ends. That is true of every indicator computed on close, including a plain moving average, and it is not repainting. It only becomes a problem if you act on an unfinished bar and the candle then closes somewhere else. The dead zone makes this sharper than usual: a bar can sit above the threshold mid-period and fall below it by the close, so a signal that looked like it existed quietly turns out not to.
Two caveats. This reasoning describes a faithful implementation of the published formula, and the indicator circulates in dozens of re-hosted versions of unverified provenance, some of which add their own alerts or smoothing. And the reasoning covers the calculation, not any arrow or alert wrapper a particular build may bolt on top. If you are running a version from a download site rather than the Code Base original, spend one session confirming it: record the histogram value of a forming bar, record it again after that bar closes, and repeat across a session boundary. Values that change after the close mean that build has added something the original does not do.
Waddah Attar Explosion is best understood as a momentum confirmation layer rather than a standalone entry system, which puts it in a different role than something like Quantum Trend Sniper, built specifically to flag reversal entries on its own. A common pattern is using a reversal or structure tool to identify a potential entry point, then checking Waddah Attar Explosion's histogram for momentum confirmation before acting on it, rather than trading its signals in isolation.
| Name | FBFX Score | Repaints | Signal type | Best timeframe | Platform |
|---|---|---|---|---|---|
| Waddah Attar Explosion (this one) | 90/100 | No | Leading | H1 | MT4, MT5 |
| TPSpro Trend Pro | 90/100 | No | Leading | H1 | MT4, MT5 |
| Quantum Trend Sniper | 88/100 | No | Leading | H1 | MT4 |
| Advanced Supply Demand | 90/100 | No | Leading | H4 | MT4, MT5 |
| Blahtech Market Profile | 90/100 | No | Leading | M15 | MT4, MT5 |
Yes. The original remains available in the public MQL5 Code Base, and it is re-hosted free across numerous MT4 and MT5 download sites, though behaviour can vary slightly by source since some re-hosted builds add their own alert or smoothing logic.
One colour marks building bullish momentum and the other bearish, with the colour set by the sign of the change in MACD. A bar crossing above the signal line is the cue the indicator uses to flag that momentum has outpaced current volatility in that direction.
There is no single best setting, because the dead zone is an absolute pip value and therefore instrument-specific. Tune it per symbol so it suppresses roughly the quietest third of bars on your timeframe, and leave sensitivity at default until you have done that, since raising sensitivity simply scales every bar and manufactures signals without any change in the market.